United States Forest Service Fire Ecology research highlights
Read the highlights below from recent research from the Pacific Northwest Research Station.
Simulated future shifts in wildfire regimes in moist forests of the Pacific Northwest, USA
Authors
Alex W. Dye, Matt J. Reilly, Andy McEvoy, Rebecca Lemons, Karin L. Riley, John B. Kim, and Becky K. Kerns
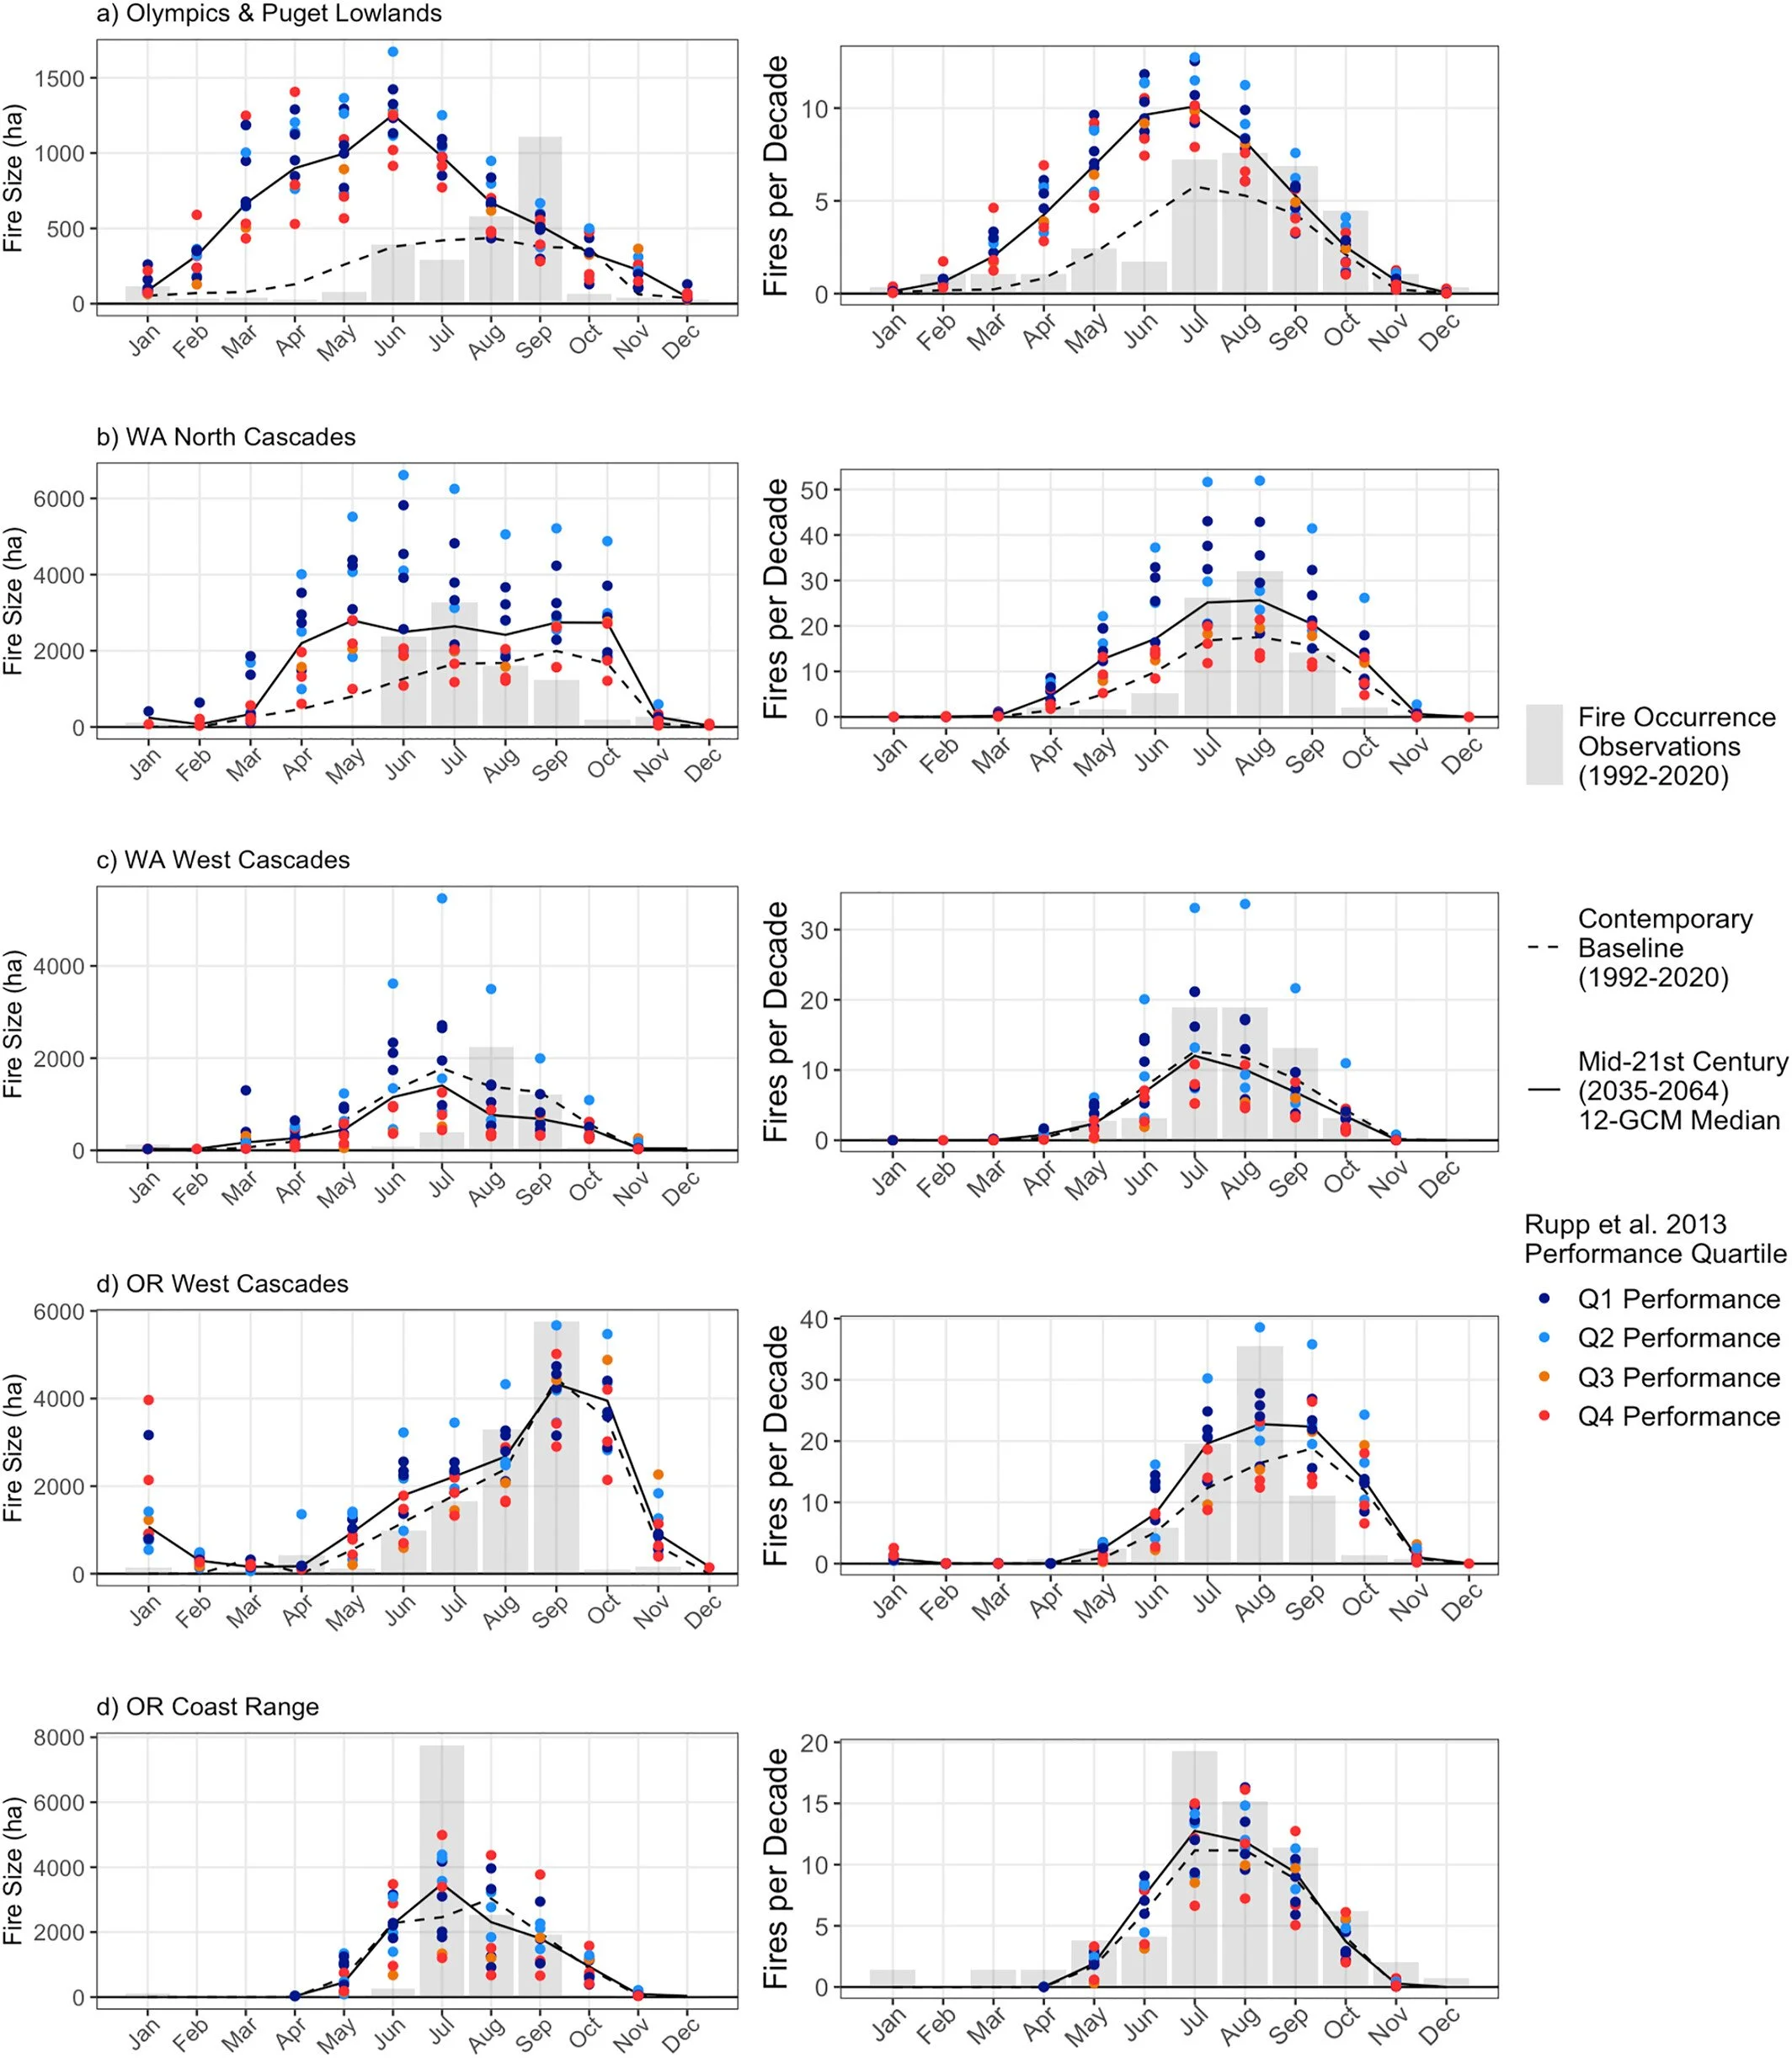
Monthly distribution of simulated fire size and number of fires per decade for the contemporary baseline (1992–2020) and mid-century future (2035–2064) scenarios. For mid-century scenarios, the median monthly value of the 12 GCM-based simulations is drawn as a solid line, and individual points for each simulation are color-coded by their Rupp et al., 2013 GCM performance ranking quartile as in Figures 3, 5 and 6. Observations from the historical fire occurrence database are shown as gray bars in background.
Summary
We simulated thousands of plausible fire seasons with the stochastic spatial fire spread model FSim for mid-21st century (2035–2064) under RCP8.5 emissions scenario for five northwestern pyromes, using 12 global climate models (GCM). The largest increases in burn probability and fire size are projected in the cooler and wetter northern parts of the region (North Cascades, Olympics & Puget Lowlands) and Oregon West Cascades, with more moderate changes projected for the Washington West Cascades and Oregon Coast Range.
Carbon, Climate, and Natural Disturbance: A review of Mechanisms, Challenges, and Tools for understanding forest cabon stability in an uncertain future
Authors
Alex W. Dye, Rachel M. Houtman, Peng Gao, William R. L. Anderegg, Christopher J. Fettig, Jeffrey A. Hicke, John B. Kim, Christopher J. Still, Kevin Young, and Karin L. Riley
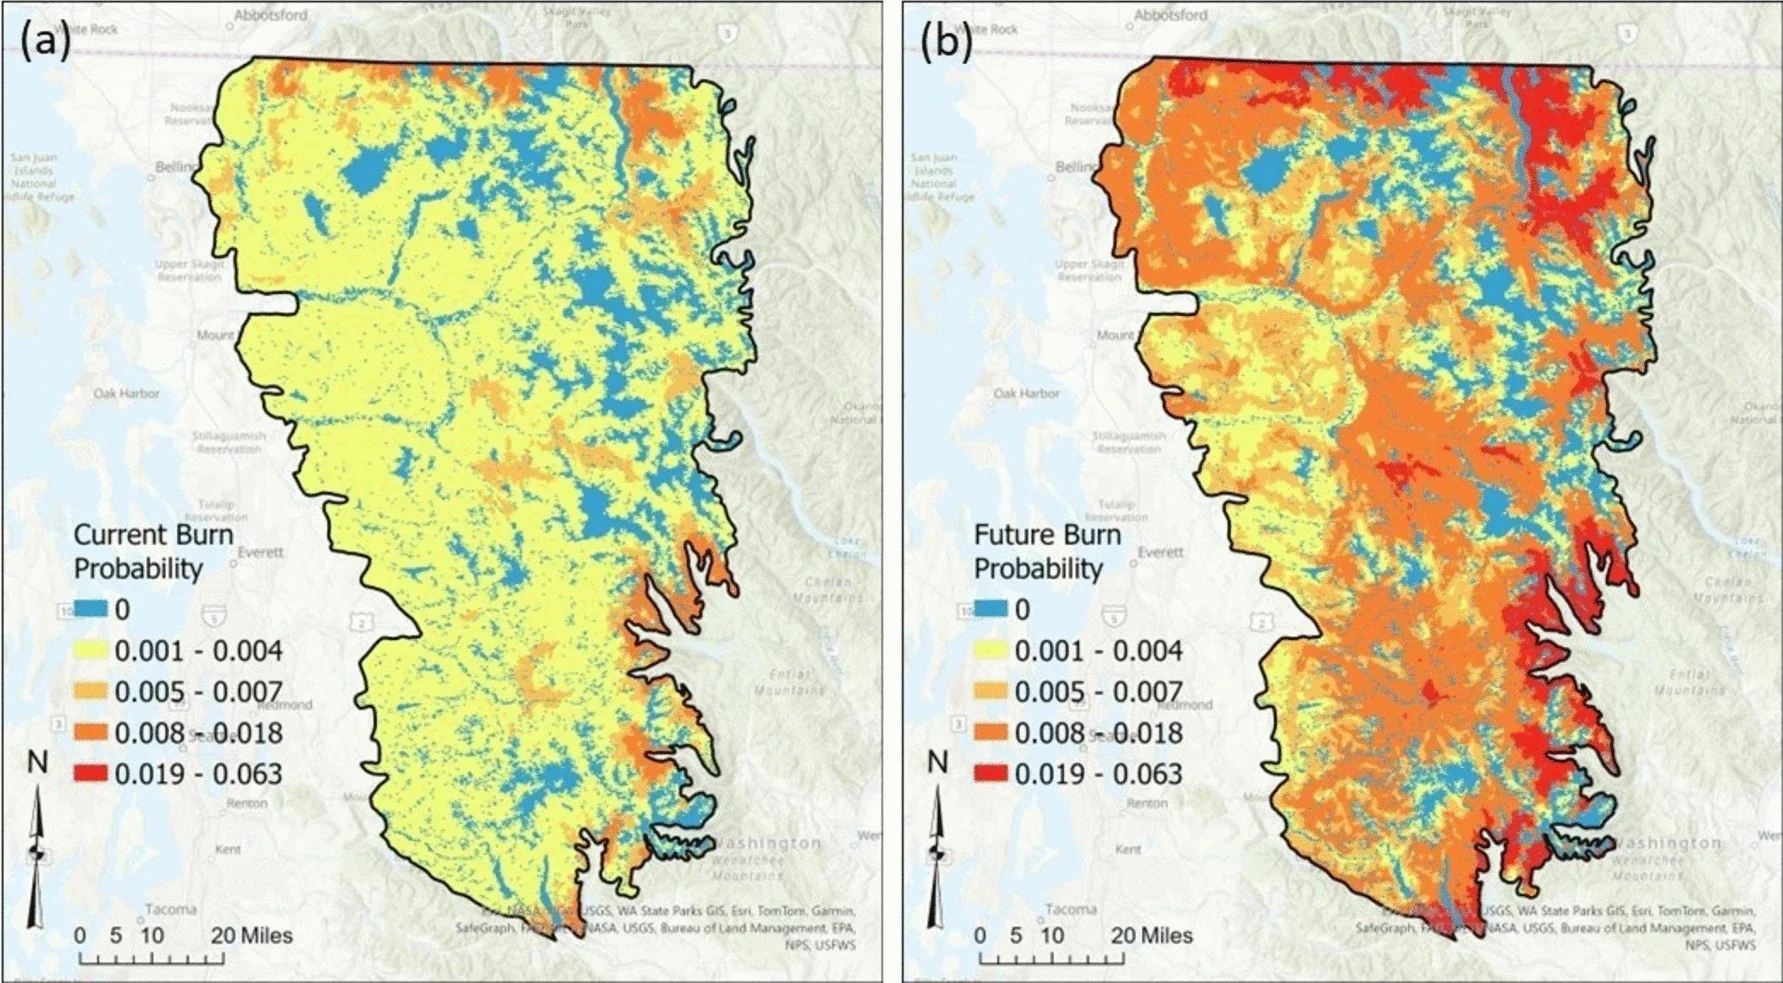
The FSim Large Fire Simulator can project how future climate change may alter spatial fire probability patterns, which can then affect forest carbon. The two maps show contemporary, 1992–2020 (a) and mid-twenty-first century, 2035–2064 (b) annual burn probability at 270-m resolution for a landscape in Cascade Mountains of northern Washington State, United States, simulated by FSim [291]
Summary
To minimize negative effects and maximize resilience of forest carbon, disturbance risks must be accounted for in carbon offset protocols, carbon management practices, and carbon mapping and modeling techniques. This requires detailed mapping and modeling of the quantities and distribution of forest carbon; the frequency, severity, and timing of disturbances; the mechanisms by which disturbances affect carbon storage; and how climate change may alter each of these elements. Fire spread models, imputed forest inventory models, and forest growth simulators address one or more of the aforementioned items and can help inform management strategies that reduce forest carbon risk and offsets.
Risk assessment in the Pyrocene – Rapid changes in models and predictions complicate US policies to prioritize forest and fuel management. Landscape & Urban Planning. (In review)
Authors
Ager, A., Day, M., Evers, C., Kim, J.B., Kerns, B.K., and Ringo, C..
Summary
Summary: We overlayed the new national wildfire simulation fire perimeters with the most recent building footprint data and found a 61% increase in building exposure in the East, and a decline of -9% in the West compared to prior version. The change in building exposure was related to multiple updates to model inputs, including ignition frequency and model re-calibration, but not building counts.
URL forthcoming